Delhi Air Quality: Zero ‘Severe’ Days This Diwali Season
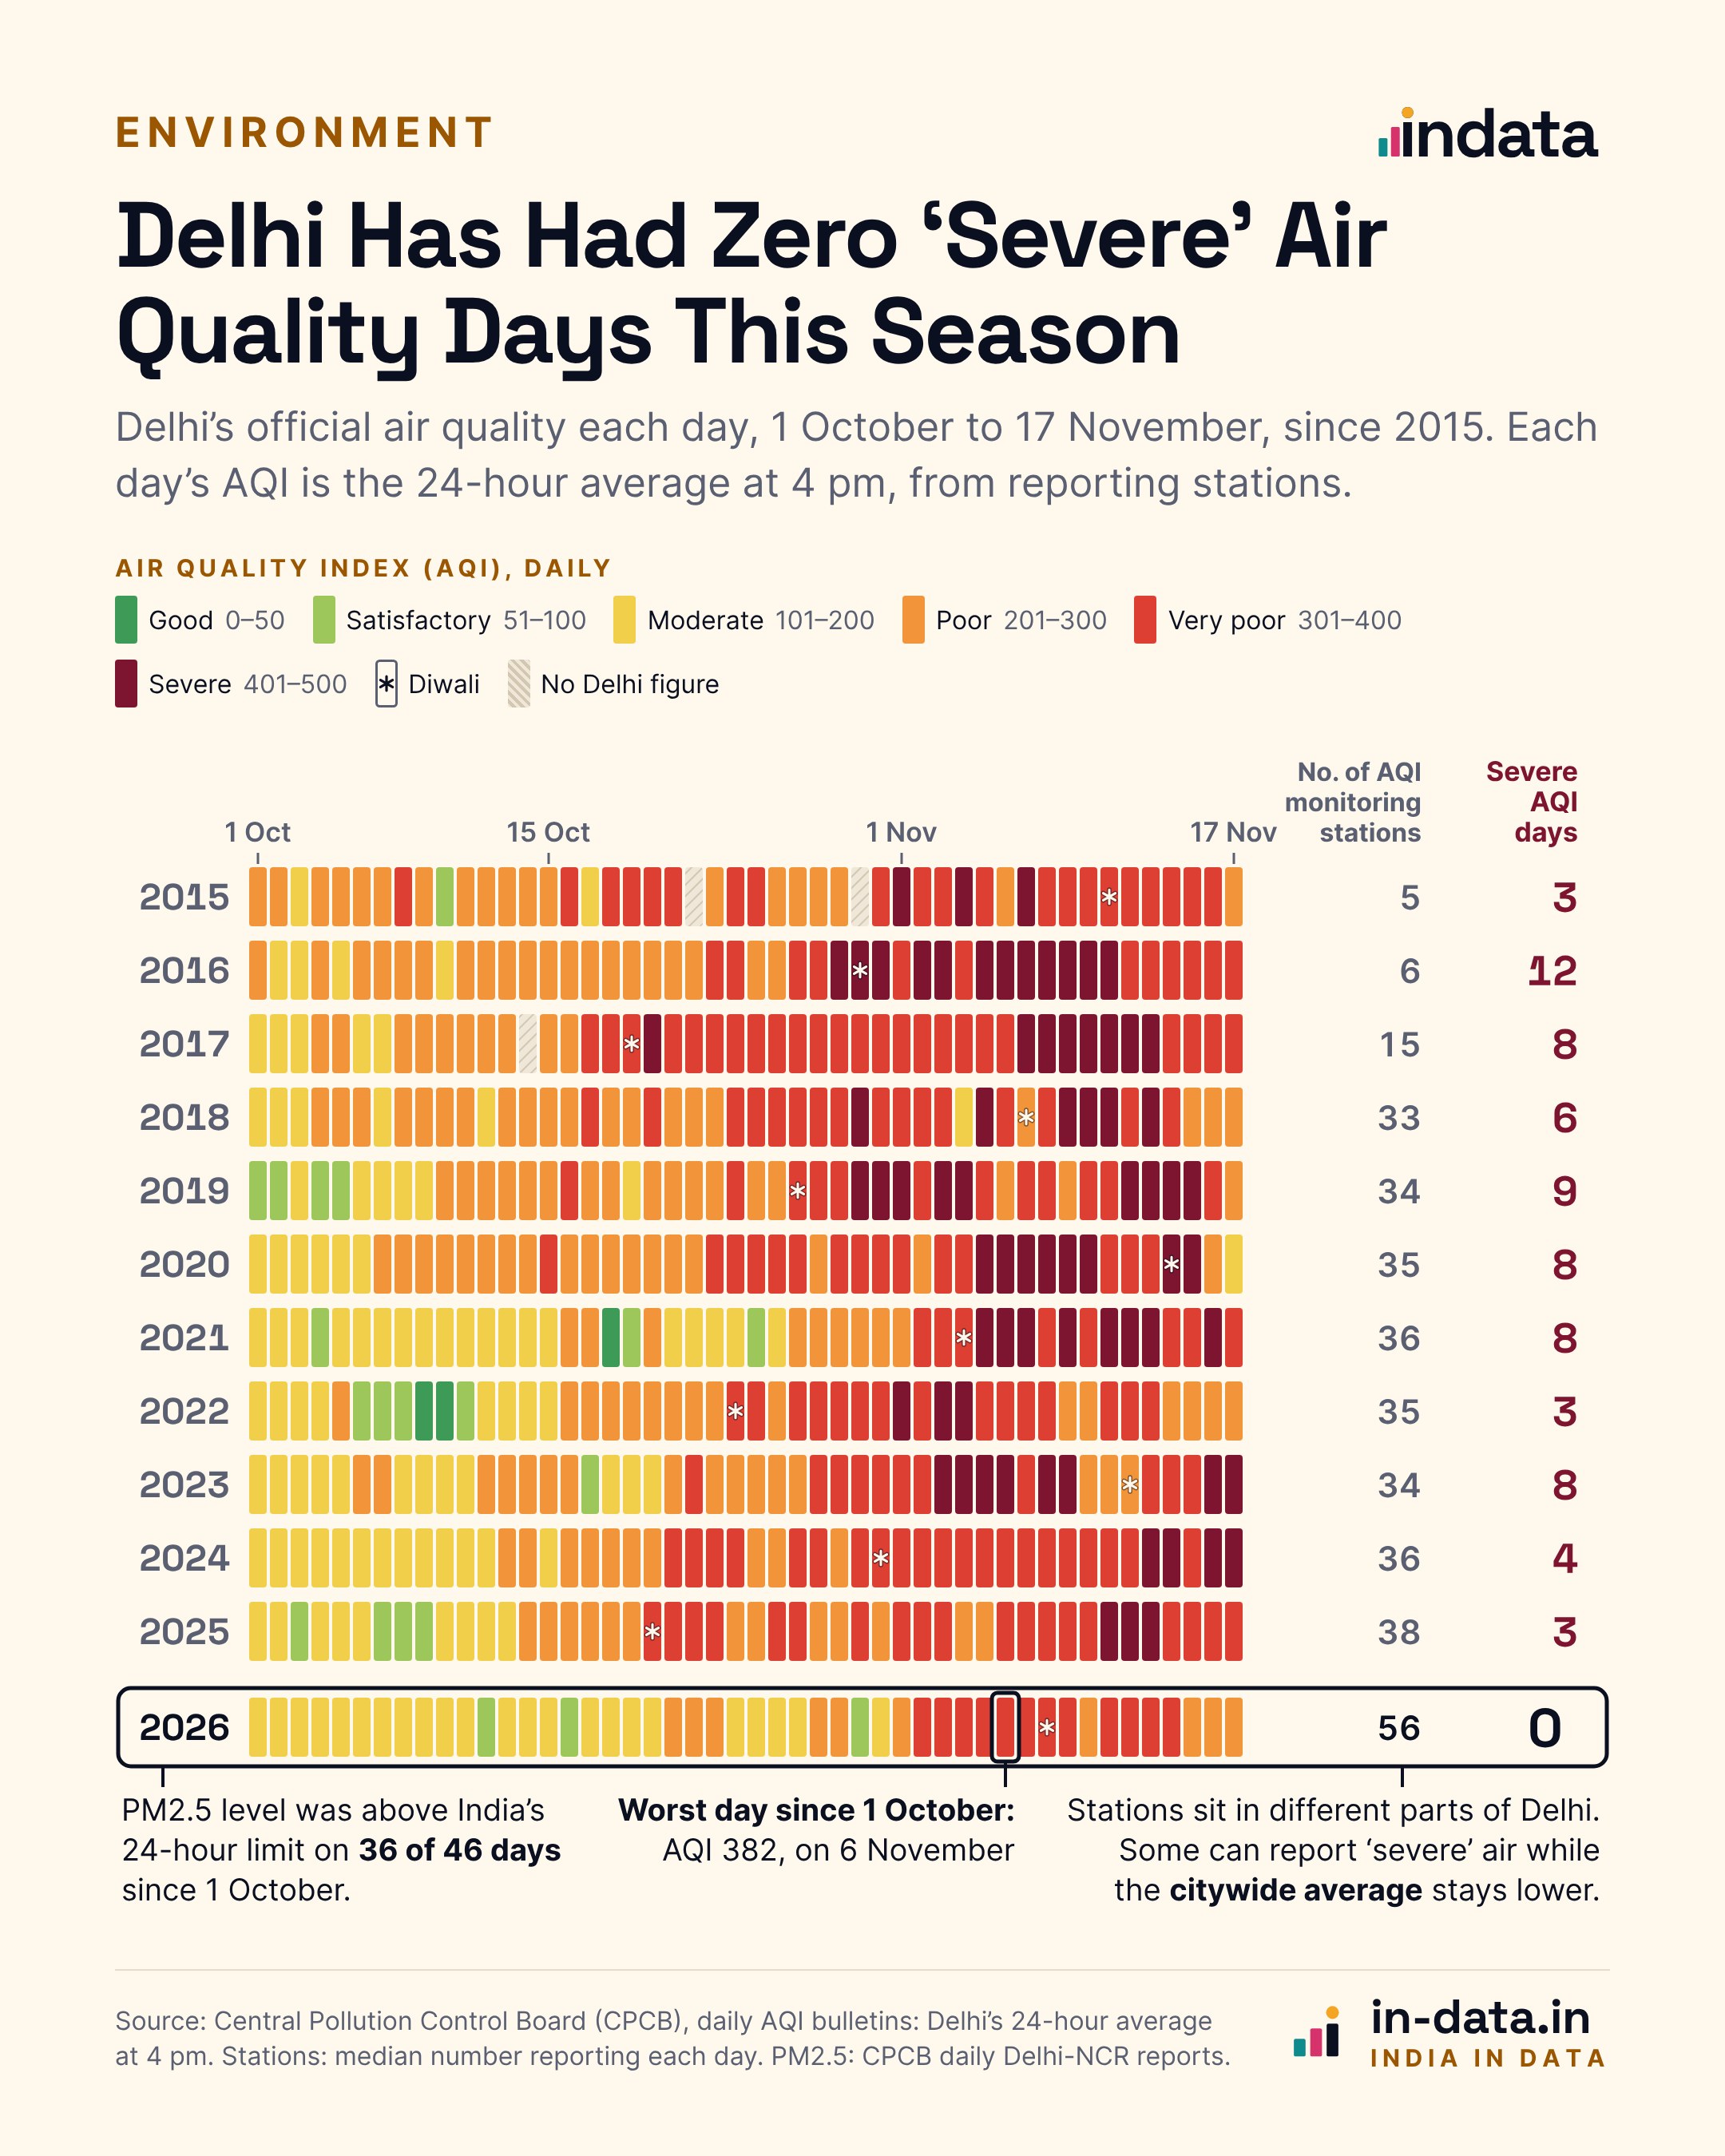
See Delhi air quality on every day from 1 October to 17 November since 2015, from the official daily bulletins.
Key takeawayEvery year since 2015 had at least three ‘severe’ air days in Delhi between 1 October and 17 November. 2026 has had none.
Delhi’s air quality is a year-round concern, but it tends to become the talk of the town towards the end of the year, and especially during the Diwali season.
This year, people reported seeing uncapped AQI counts in the thousands on weather apps and private platforms. However, official numbers from the Central Pollution Control Board (CPCB) tell a different story.
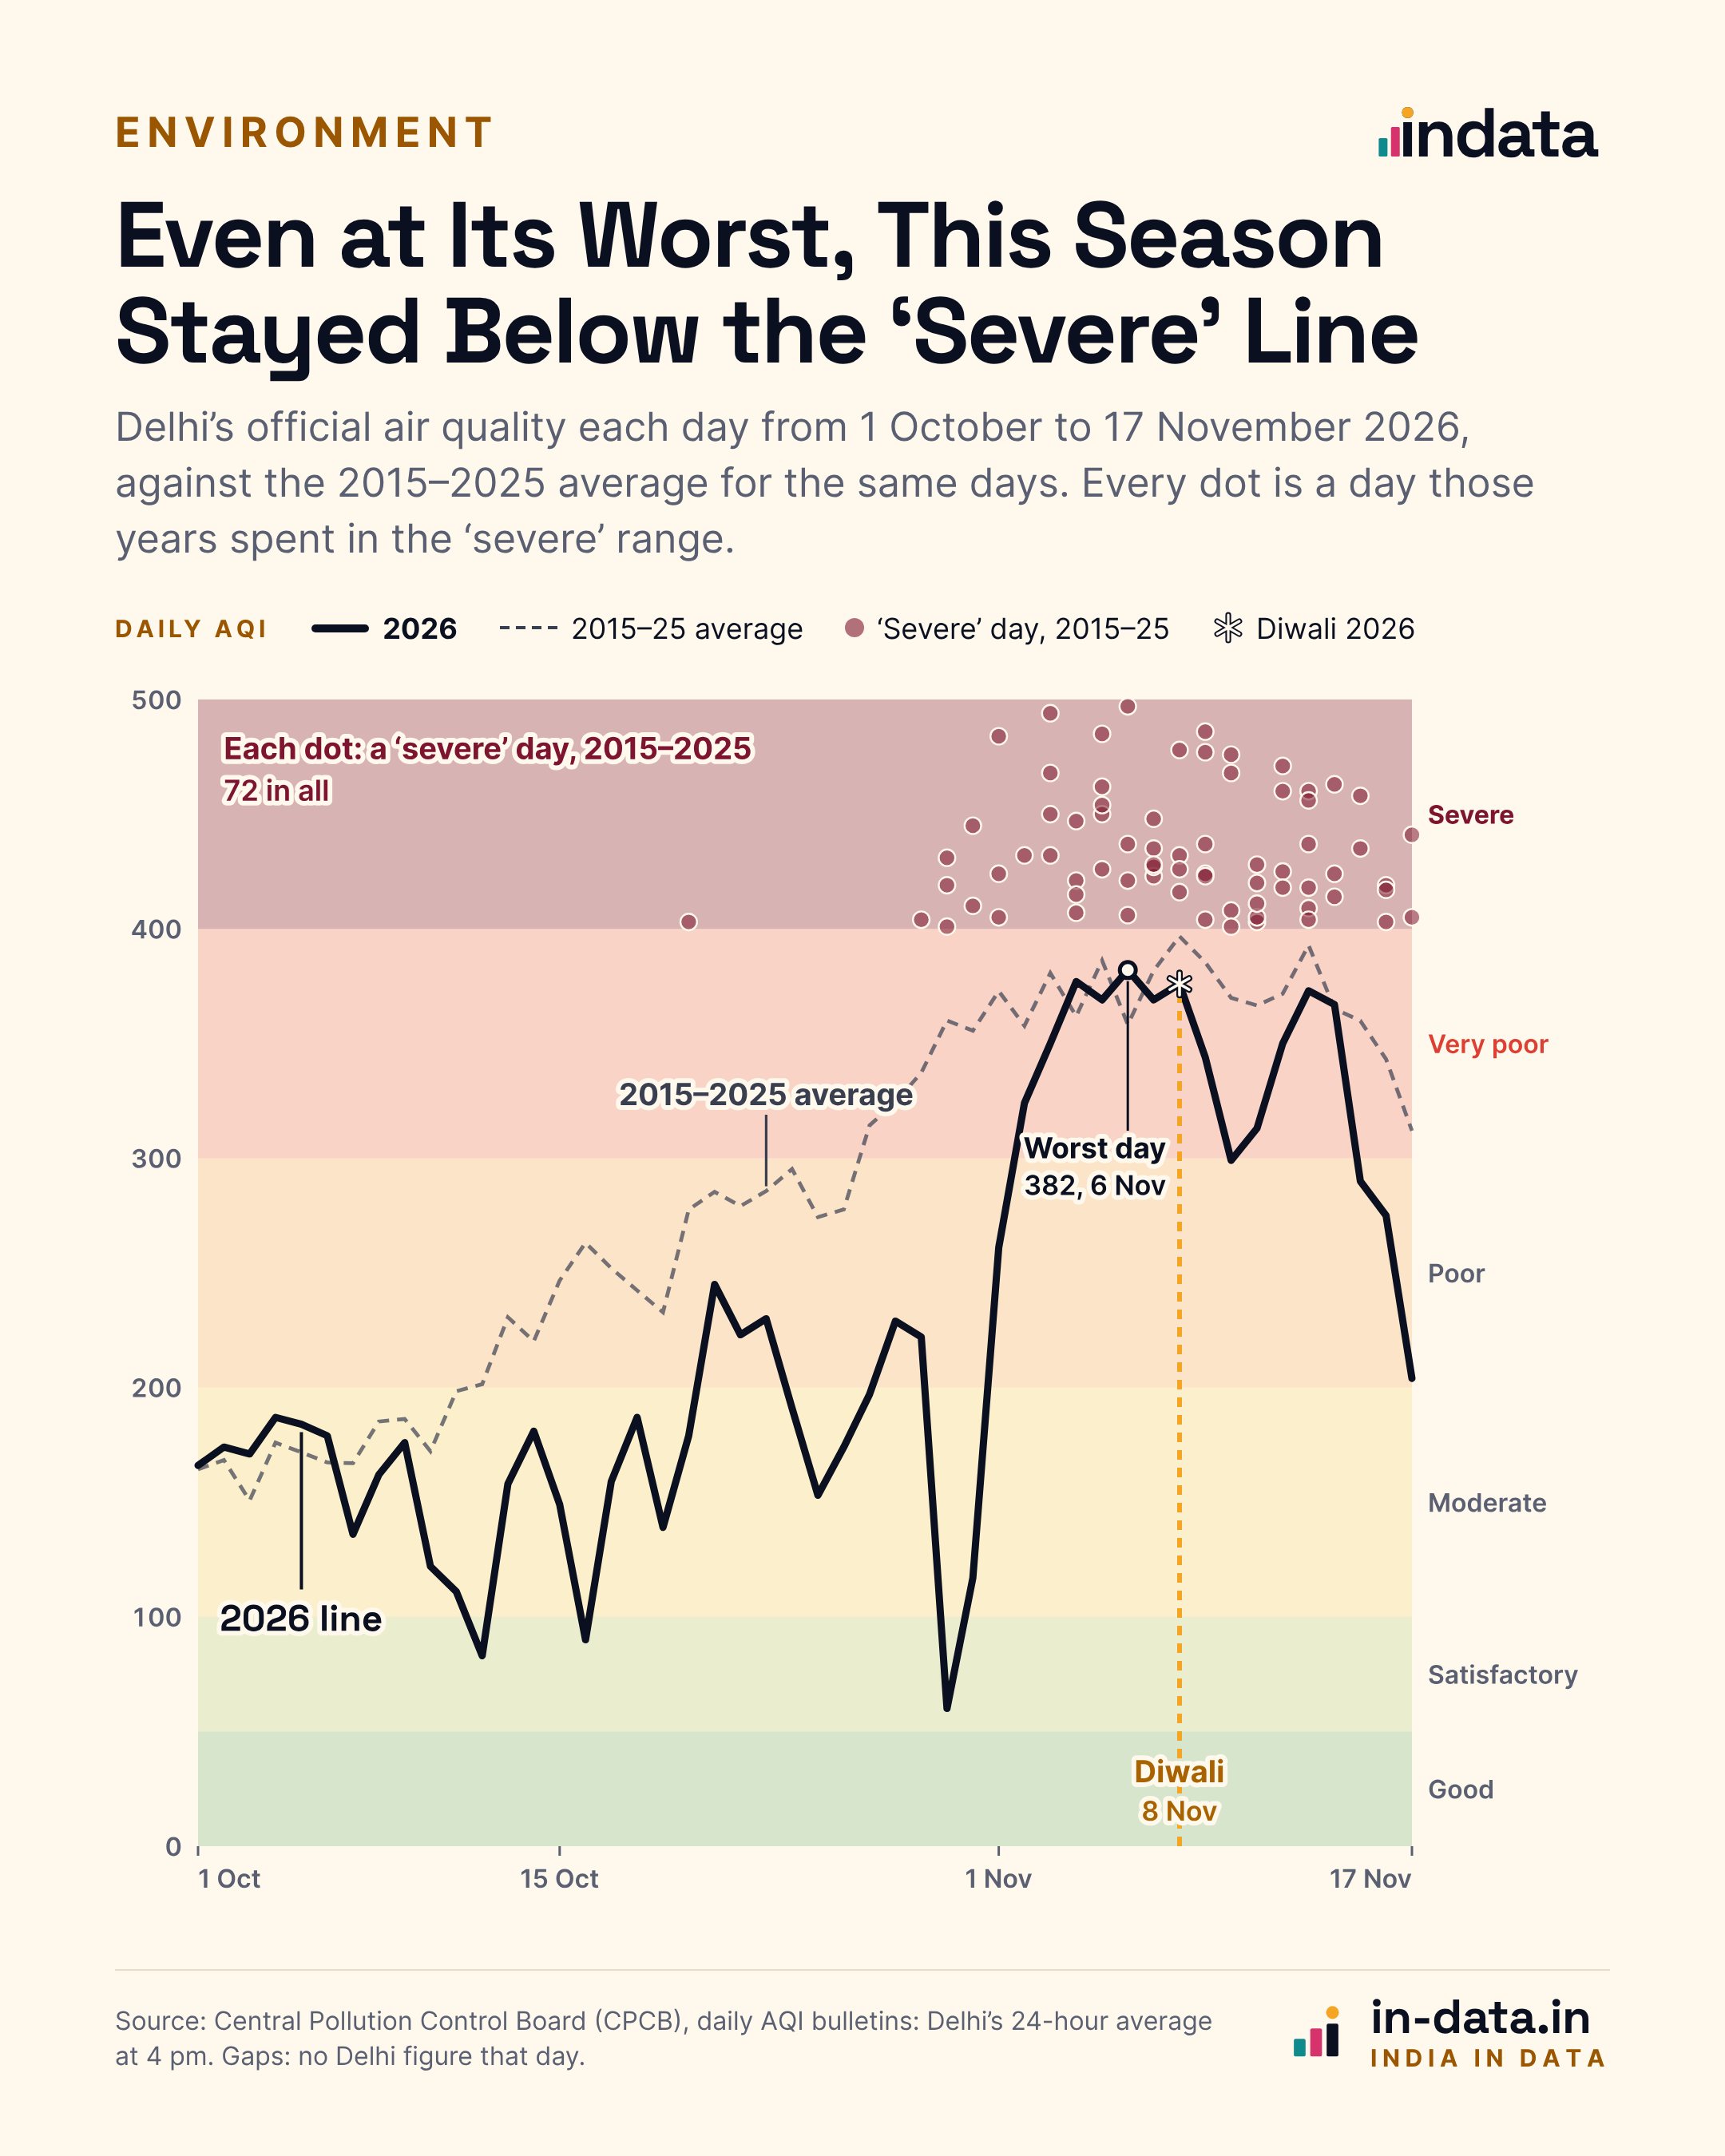
This infographic shows how Delhi’s daily air quality index (AQI) in 2026 compares with previous years over the same period, 1 October to 17 November.
How the CPCB Measures Air Quality
India’s National Air Quality Index, launched in 2014, turns up to eight pollutants into one number between 0 and 500: PM2.5, PM10, nitrogen dioxide, sulphur dioxide, carbon monoxide, ozone, ammonia and lead.
Each pollutant gets a score based on its average concentration over 24 hours (eight hours for carbon monoxide and ozone). The worst score becomes the AQI. A station needs at least three pollutants, one of them PM2.5 or PM10, to report a figure at all.
Delhi’s daily number is the average of the AQI at every station reporting, published at 4 pm for the past 24 hours. The scale stops at 500: anything worse is simply ‘severe’.
Each day falls into one of six categories. The CPCB’s daily bulletin lists the possible health impact of each:
- Good (0–50): minimal impact.
- Satisfactory (51–100): minor breathing discomfort to sensitive people.
- Moderate (101–200): breathing discomfort to people with lung, asthma and heart diseases.
- Poor (201–300): breathing discomfort to most people on prolonged exposure.
- Very poor (301–400): respiratory illness on prolonged exposure.
- Severe (401–500): affects healthy people and seriously impacts those with existing diseases.
That is why apps show bigger numbers. Many use a US scale that keeps going past 500, show hourly rather than 24-hour readings, or report one location rather than the city. On the morning of 13 November, for example, Delhi’s AQI was reported at 419; the official 24-hour figure that afternoon was 373.
No ‘Severe’ Air Day Yet This Season
Delhi’s AQI has not crossed 400, the line for ‘severe’, on a single day this season. The worst day so far was 6 November, at 382. Diwali, two days later, came in at 376.
That has never happened in this stretch before, though 2026 did have two ‘severe’ days in January. Every year from 2015 to 2025 had at least three ‘severe’ days by 17 November, and 2016 had 12.
| Year | ‘Severe’ AQI days | ‘Very poor’ AQI days | Average AQI |
|---|---|---|---|
| 2015 | 3 | 21 | 299 |
| 2016 | 12 | 12 | 317 |
| 2017 | 8 | 24 | 322 |
| 2018 | 6 | 16 | 295 |
| 2019 | 9 | 12 | 282 |
| 2020 | 8 | 15 | 300 |
| 2021 | 8 | 8 | 248 |
| 2022 | 3 | 15 | 254 |
| 2023 | 8 | 11 | 276 |
| 2024 | 4 | 21 | 284 |
| 2025 | 3 | 19 | 268 |
| 2026 | 0 | 12 | 224 |
1 October to 17 November each year. ‘Severe’ is an AQI of 401 to 500; ‘very poor’ is 301 to 400. 2015 is missing two days and 2017 one, with no Delhi figure.
The season’s average AQI so far is 224, the lowest of the 12 years. The next-cleanest was 2021, at 248.
The network behind these numbers has also grown. In 2015, the city figure rested on about five monitoring stations on a typical day. This year it draws on 56, run by agencies including the CPCB, the Delhi Pollution Control Committee (DPCC) and the Indian Institute of Tropical Meteorology (IITM). The earliest years in the table rest on far fewer readings.
Cleaner Is Still Not Clean
A better year is not a good one. Delhi’s air was ‘very poor’ on 12 days this season: every day from 2 to 14 November except the 10th.
The concentrations behind the index tell the same story. PM2.5, the fine dust that was a main pollutant on 35 of this season’s 48 days, averaged 149 micrograms per cubic metre (µg/m³) between 21 October and 16 November, according to the board’s daily Delhi-NCR reports. That is down from 194 in 2025 and 209 in 2024, but still about two and a half times India’s 24-hour limit of 60.
Coarser PM10 averaged 265 µg/m³ over the same days, down from 330 and 357, and more than two and a half times its limit of 100. Since 1 October, Delhi has been over the PM2.5 limit on 36 of the 46 days with data, and over the PM10 limit on 43.
Fewer farm fires are not the reason for the improvement. Punjab counted 5,972 crop-residue fires between 15 September and 15 November, more than the 4,877 in the same period last year, according to the Indian Agricultural Research Institute’s count in the same report.
A Gap in the Diwali Data
The official numbers have a blind spot at their worst moments. The CPCB said its system leaves out hourly particulate readings above 999 µg/m³, under validation rules set in 2015. The day after Diwali, 45 of Delhi’s 59 stations had at least one pollutant with missing hours.
Those hours do not count towards the 24-hour average, so the official figure can understate the sharpest spikes. The rule dates from 2015, so it applies to every year in this comparison. The board says it is reviewing the method.
These numbers stop at 17 November. The rest of the winter is still to come.
Source and method
CPCB, daily AQI bulletins, 1 October to 17 November of each year from 2015 to 2026: Delhi’s index, the average of the past 24 hours at 4 pm. Every bulletin was downloaded and checked on 17 November 2026: 573 days with a Delhi figure. Three days have none: the bulletins for 22 and 30 October 2015 give no figure for Delhi, and there is no bulletin for 14 October 2017. Days are grouped by the board’s own AQI ranges. One bulletin, 15 November 2023, labels an index of 398 ‘severe’; we count it as ‘very poor’, as its value says. The number of stations behind the city figure has grown from a median of five a day in 2015 to 56 in 2026 (as few as one on some days in 2015 and 2016, as many as 59 in 2026). Diwali dates are from calendarific.com’s table of Indian holidays. PM2.5 and PM10 come from CPCB’s daily ‘Air Quality Status for Delhi & NCR’ reports (24-hour averages, 6 am to 6 am), which give the same date for the two previous years; for 2024 and 2025 they start on 21 October. Limits are India’s National Ambient Air Quality Standards (24 hours: PM2.5 60 µg/m³, PM10 100 µg/m³). Farm-fire counts in the same reports come from the ICAR-Indian Agricultural Research Institute.