India’s Inflation in October 2026: Why Food Was Half of It
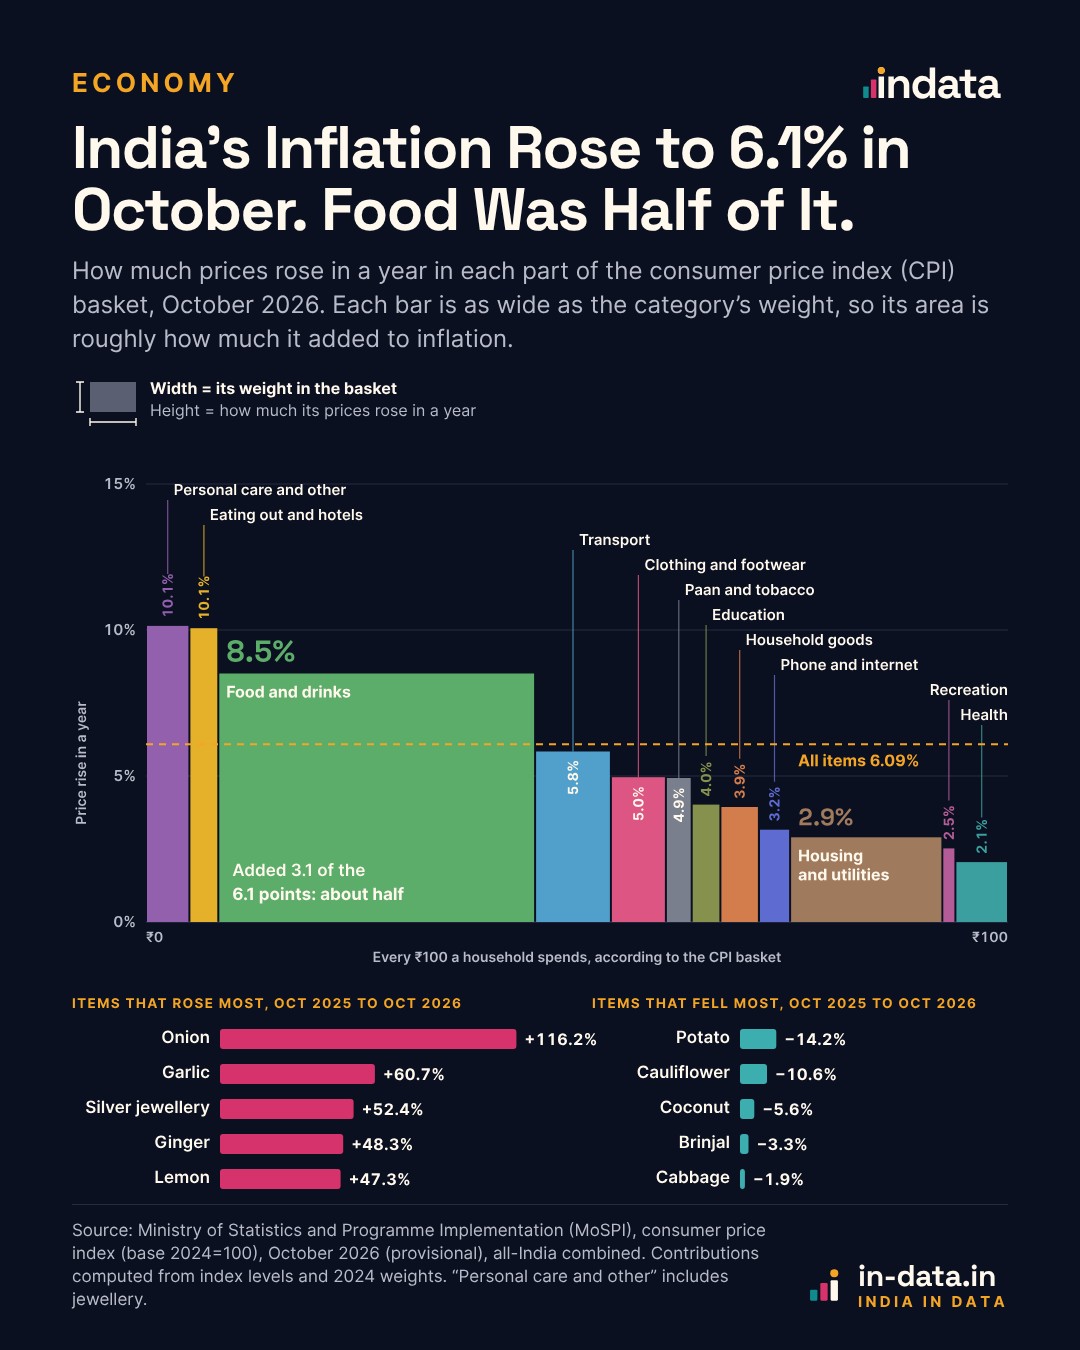
See India’s inflation in October 2026 broken down by spending category: how much of the household basket each part takes up, how fast its prices rose, and what the two together added to the total.
Key takeawayFood and drinks added about half of India’s 6.09% inflation in October.
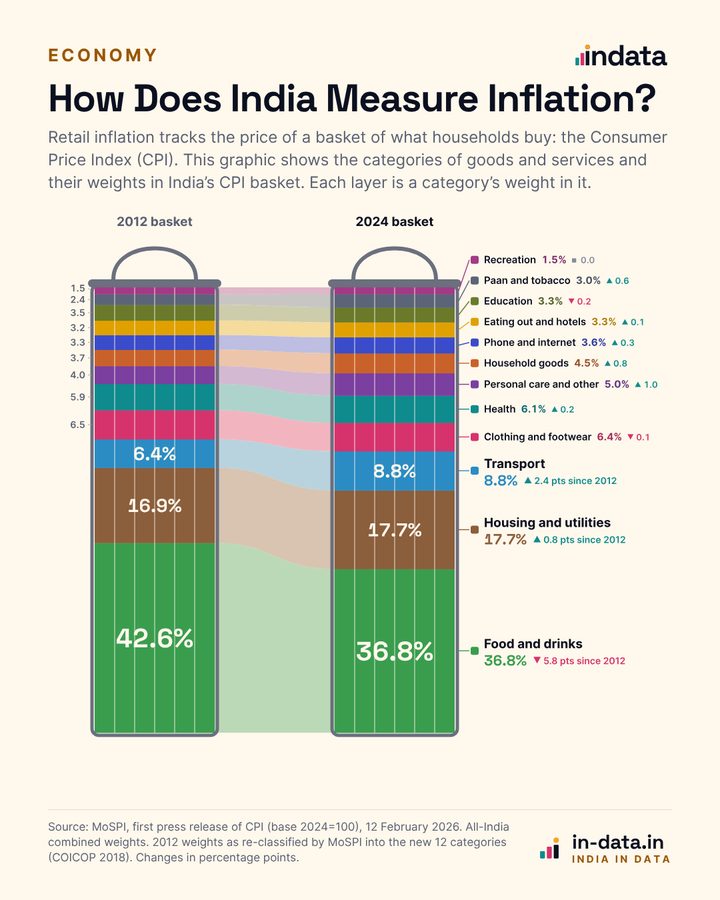
Retail inflation is the rise in the consumer price index (CPI) over a year. The index tracks the price of a fixed basket of things households buy, and each category counts in proportion to how much households spend on it. Our piece on the CPI basket shows those weights.
In October 2026 prices were 6.09% higher than a year earlier, according to the Ministry of Statistics and Programme Implementation (MoSPI). The graphic shows where that came from. Each category is a bar with two measures: its width is the category’s share of household spending, and its height is how much its prices rose in a year.
The two multiply. Food and drinks take up 36.75% of the basket and their prices rose 8.51%, and 36.75% of 8.51% is about 3.13. That is the number of percentage points food added to the 6.09% total: about half.
India’s Inflation in October 2026, by Category
Personal care and eating out had the fastest price rises, at about 10% each, but both are small parts of the basket. Eating out takes up 3.35% of spending, so even a 10.06% rise adds only about 0.34 points. Food rose less, but it is eleven times as large a share.
| Category | Weight in basket | Inflation, October 2026 | Points added |
|---|---|---|---|
| Food and drinks | 36.75% | 8.51% | 3.13 |
| Personal care and other | 5.04% | 10.14% | 0.56 |
| Transport | 8.80% | 5.84% | 0.50 |
| Housing and utilities | 17.66% | 2.90% | 0.50 |
| Eating out and hotels | 3.35% | 10.06% | 0.34 |
| Clothing and footwear | 6.38% | 4.96% | 0.32 |
| Household goods | 4.47% | 3.94% | 0.17 |
| Paan and tobacco | 2.99% | 4.93% | 0.15 |
| Education | 3.33% | 4.02% | 0.14 |
| Health | 6.10% | 2.05% | 0.12 |
| Phone and internet | 3.61% | 3.16% | 0.11 |
| Recreation | 1.52% | 2.52% | 0.04 |
| All items | 100.00% | 6.09% | 6.09 |
Housing and utilities show the reverse case. It is the second-heaviest category, but its prices rose only 2.90%, so it added no more than transport did.
Ten months of rising inflation
Inflation has risen in every month of 2026. It was 2.74% in January and 5.54% in September. Since June it has been above 4%, the level the Reserve Bank of India (RBI) is asked to aim for.
October’s rise was broad. Prices rose faster than in September in 11 of the 12 categories. The exception was personal care and other, which slowed from 13.75% to 10.14% as silver jewellery inflation eased from 87.82% to 52.39%. Reuters reported that 19 of the index’s 43 sub-groups now have inflation of 4% or more, up from 14 in September, and that inflation excluding food and fuel rose to 4.5% from 4.3%, on IDFC First Bank’s estimate.
Even so, most of the month’s increase came from food. Food and drinks added 3.13 points in October against 2.71 in September, which is 0.42 of the 0.55-point rise in the total.
Why food prices rose
A handful of kitchen staples stand out. Onion prices were 116.22% higher than a year earlier, garlic 60.74%, ginger 48.32% and lemon 47.30%. Not all vegetables rose: potato was 14.24% cheaper and cauliflower 10.57% cheaper.
Onions show how this happens. Most of India’s onions come from one crop, harvested from March to May and then stored. From June to November the country lives on that stock, and Outlook Business reports that a fifth to two-fifths of it can be lost in storage. This year, traders told ETV Bharat, rain and heat in May and June rotted stored onions, and erratic weather in Maharashtra, Madhya Pradesh and Karnataka hurt the crop that follows, which begins to arrive around November.
By 12 November the average retail price was about ₹54 a kg, double the level a year earlier, according to Down To Earth. From late August the government sold onions from its reserve stock at ₹35 a kg in cities including Delhi, Outlook Business reported.
The weather may matter beyond onions. The RBI’s governor has said a weak monsoon and a strong El Niño pose risks to farming, while noting that foodgrain stocks are ample, Reuters reported. Our data shows which prices rose, not why, so these are the explanations given by traders and officials, not something the price index can confirm.
What the 6% mark means
The RBI is required to keep retail inflation at 4%, within a band of 2% to 6%. In March 2026 the government kept that target unchanged for the five years to March 2031. October’s 6.09% is just above the top of the band.
One month above 6% is not a failure under the law. The test is longer: in 2022, after inflation averaged more than 6% for three quarters in a row, the RBI had to send the government a report explaining why, the first time it had done so.
The RBI had already moved before this figure came out. On 7 October it raised its main interest rate, the repo rate, from 5.25% to 5.50%. Reuters called it the first increase in nearly four years. The bank cited food and fuel prices, oil, a deficient monsoon and El Niño, and projected inflation of 6.0% for the October to December quarter. Its rate-setting committee next meets from 2 to 4 December. The October figure is provisional and may be revised before then.
A basket with less food in it
This is the first time inflation has crossed 6% in the current price series, which began this year. In February, MoSPI replaced the old index, based on 2012 spending, with one based on 2024. The new basket has 358 items instead of 299, and food and drinks make up 36.75% of it, down from 45.86%, reflecting a household spending survey for 2023-24.
Two things follow. Year-on-year figures in the new series start in January 2026, which is why our line begins there; inflation last exceeded 6% two years ago, under the old index. And food now has to rise faster than before to move the total by the same amount. In October it still accounted for half.
Source and method
MoSPI, press release of the Consumer Price Index on base 2024 = 100 for October 2026, dated 12 November 2026 (provisional). All-India combined figures. Category names are shortened from the 12 official divisions. Weights are the 2024 basket weights. Points added are computed by InData from the release’s index levels and weights: weight × the rise in the category’s index over the year, divided by the all-items index a year earlier. Multiplying a category’s weight by its inflation rate gives nearly the same answer and is the shortcut used in the text; the two differ slightly for categories whose prices have moved far from the average since 2024. Monthly rates for 2026 are from the same release. September category figures are from MoSPI’s September 2026 release.