India’s GDP by Industry: Services Make More Than Half
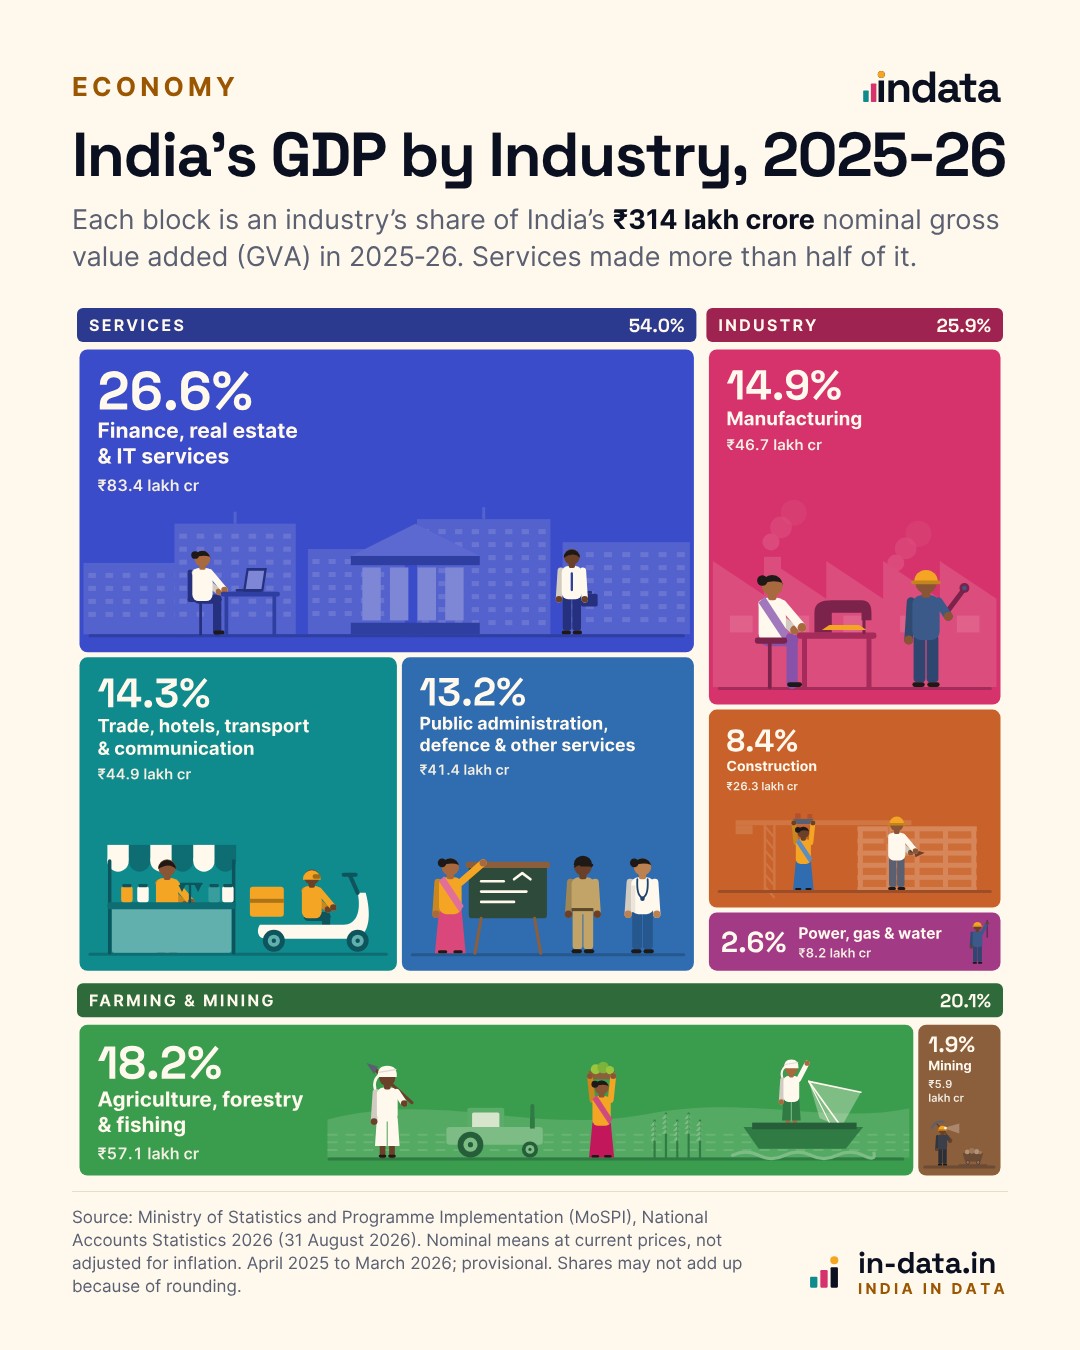
This graphic breaks down India’s GDP by industry in 2025-26: each block is one industry’s share of the value the economy produced, with the people who do that work.
Key takeawayOf every ₹100 of value India’s economy produced in 2025-26, about ₹54 came from services and ₹18 from farming.
India is the world’s sixth-largest economy, and the International Monetary Fund (IMF) expects it to become the fourth-largest in 2027. It is also the fastest-growing of the major economies. India’s real gross domestic product (GDP) grew 7.8% in 2025-26, while China’s grew 5.0% in 2025, according to the IMF’s October outlook.
This graphic shows each industry’s share of India’s economy in 2025-26 in nominal terms, meaning at current prices, using the latest figures from the Ministry of Statistics and Programme Implementation (MoSPI). GDP, the value of everything the economy produces in a year, came to ₹345 lakh crore.
To see which industries produced it, statisticians use a slightly different measure: gross value added (GVA). It counts what each industry adds on top of what it buys from others, so a car is not counted once at the steel mill and again at the showroom. Add taxes on products, take away subsidies, and you get GDP. India’s GVA in 2025-26 was ₹314 lakh crore, and the graphic splits it into eight industries, drawn to scale and grouped the way MoSPI groups them.
Overall, services made up more than half of India’s economy, from banks and software firms to shops, buses, schools and government offices. Farming, by contrast, made up less than a fifth.
India’s GDP by Industry in 2025-26
Finance, real estate and IT is the largest industry by gross value added, making up 26.6% of India’s total. Agriculture comes second at 18.2%. However, its share has been declining for decades as India moves toward a services-based economy: in 1950, agriculture made up about half of the economy.
The table below shows the full breakdown of India’s GDP by industry in 2025-26:
| Industry | Share of GVA | Value, ₹ lakh crore | Real growth |
|---|---|---|---|
| Finance, real estate, IT & professional services | 26.6% | ₹83.4 | 10.5% |
| Agriculture, livestock, forestry & fishing | 18.2% | ₹57.1 | 3.3% |
| Manufacturing | 14.9% | ₹46.7 | 8.8% |
| Trade, hotels, transport & communication | 14.3% | ₹44.9 | 11.3% |
| Public administration, defence & other services | 13.2% | ₹41.4 | 6.3% |
| Construction | 8.4% | ₹26.3 | 7.2% |
| Electricity, gas, water & other utilities | 2.6% | ₹8.2 | 2.1% |
| Mining & quarrying | 1.9% | ₹5.9 | 7.1% |
| All industries | 100.0% | ₹313.9 | 7.9% |
The top industry isn’t all banks and software. It also includes legal, accounting and other professional services, along with real estate services such as renting and brokerage. In addition, it includes “ownership of dwellings”, which counts the rent people would pay if they did not own their homes. Statisticians include it so that a country of homeowners and a country of renters are measured the same way. In fact, in 2024-25, the latest year with this detail, ownership of dwellings added ₹21.8 lakh crore, more than IT and computer services at ₹20.0 lakh crore.
Services were also the fastest-growing part of the economy. After adjusting for inflation, trade, hotels and transport grew 11.3% in 2025-26, while finance, real estate and IT grew 10.5%. Manufacturing grew 8.8%. Farming, on the other hand, grew 3.3%. As a result, services continue to take a larger share of the economy.
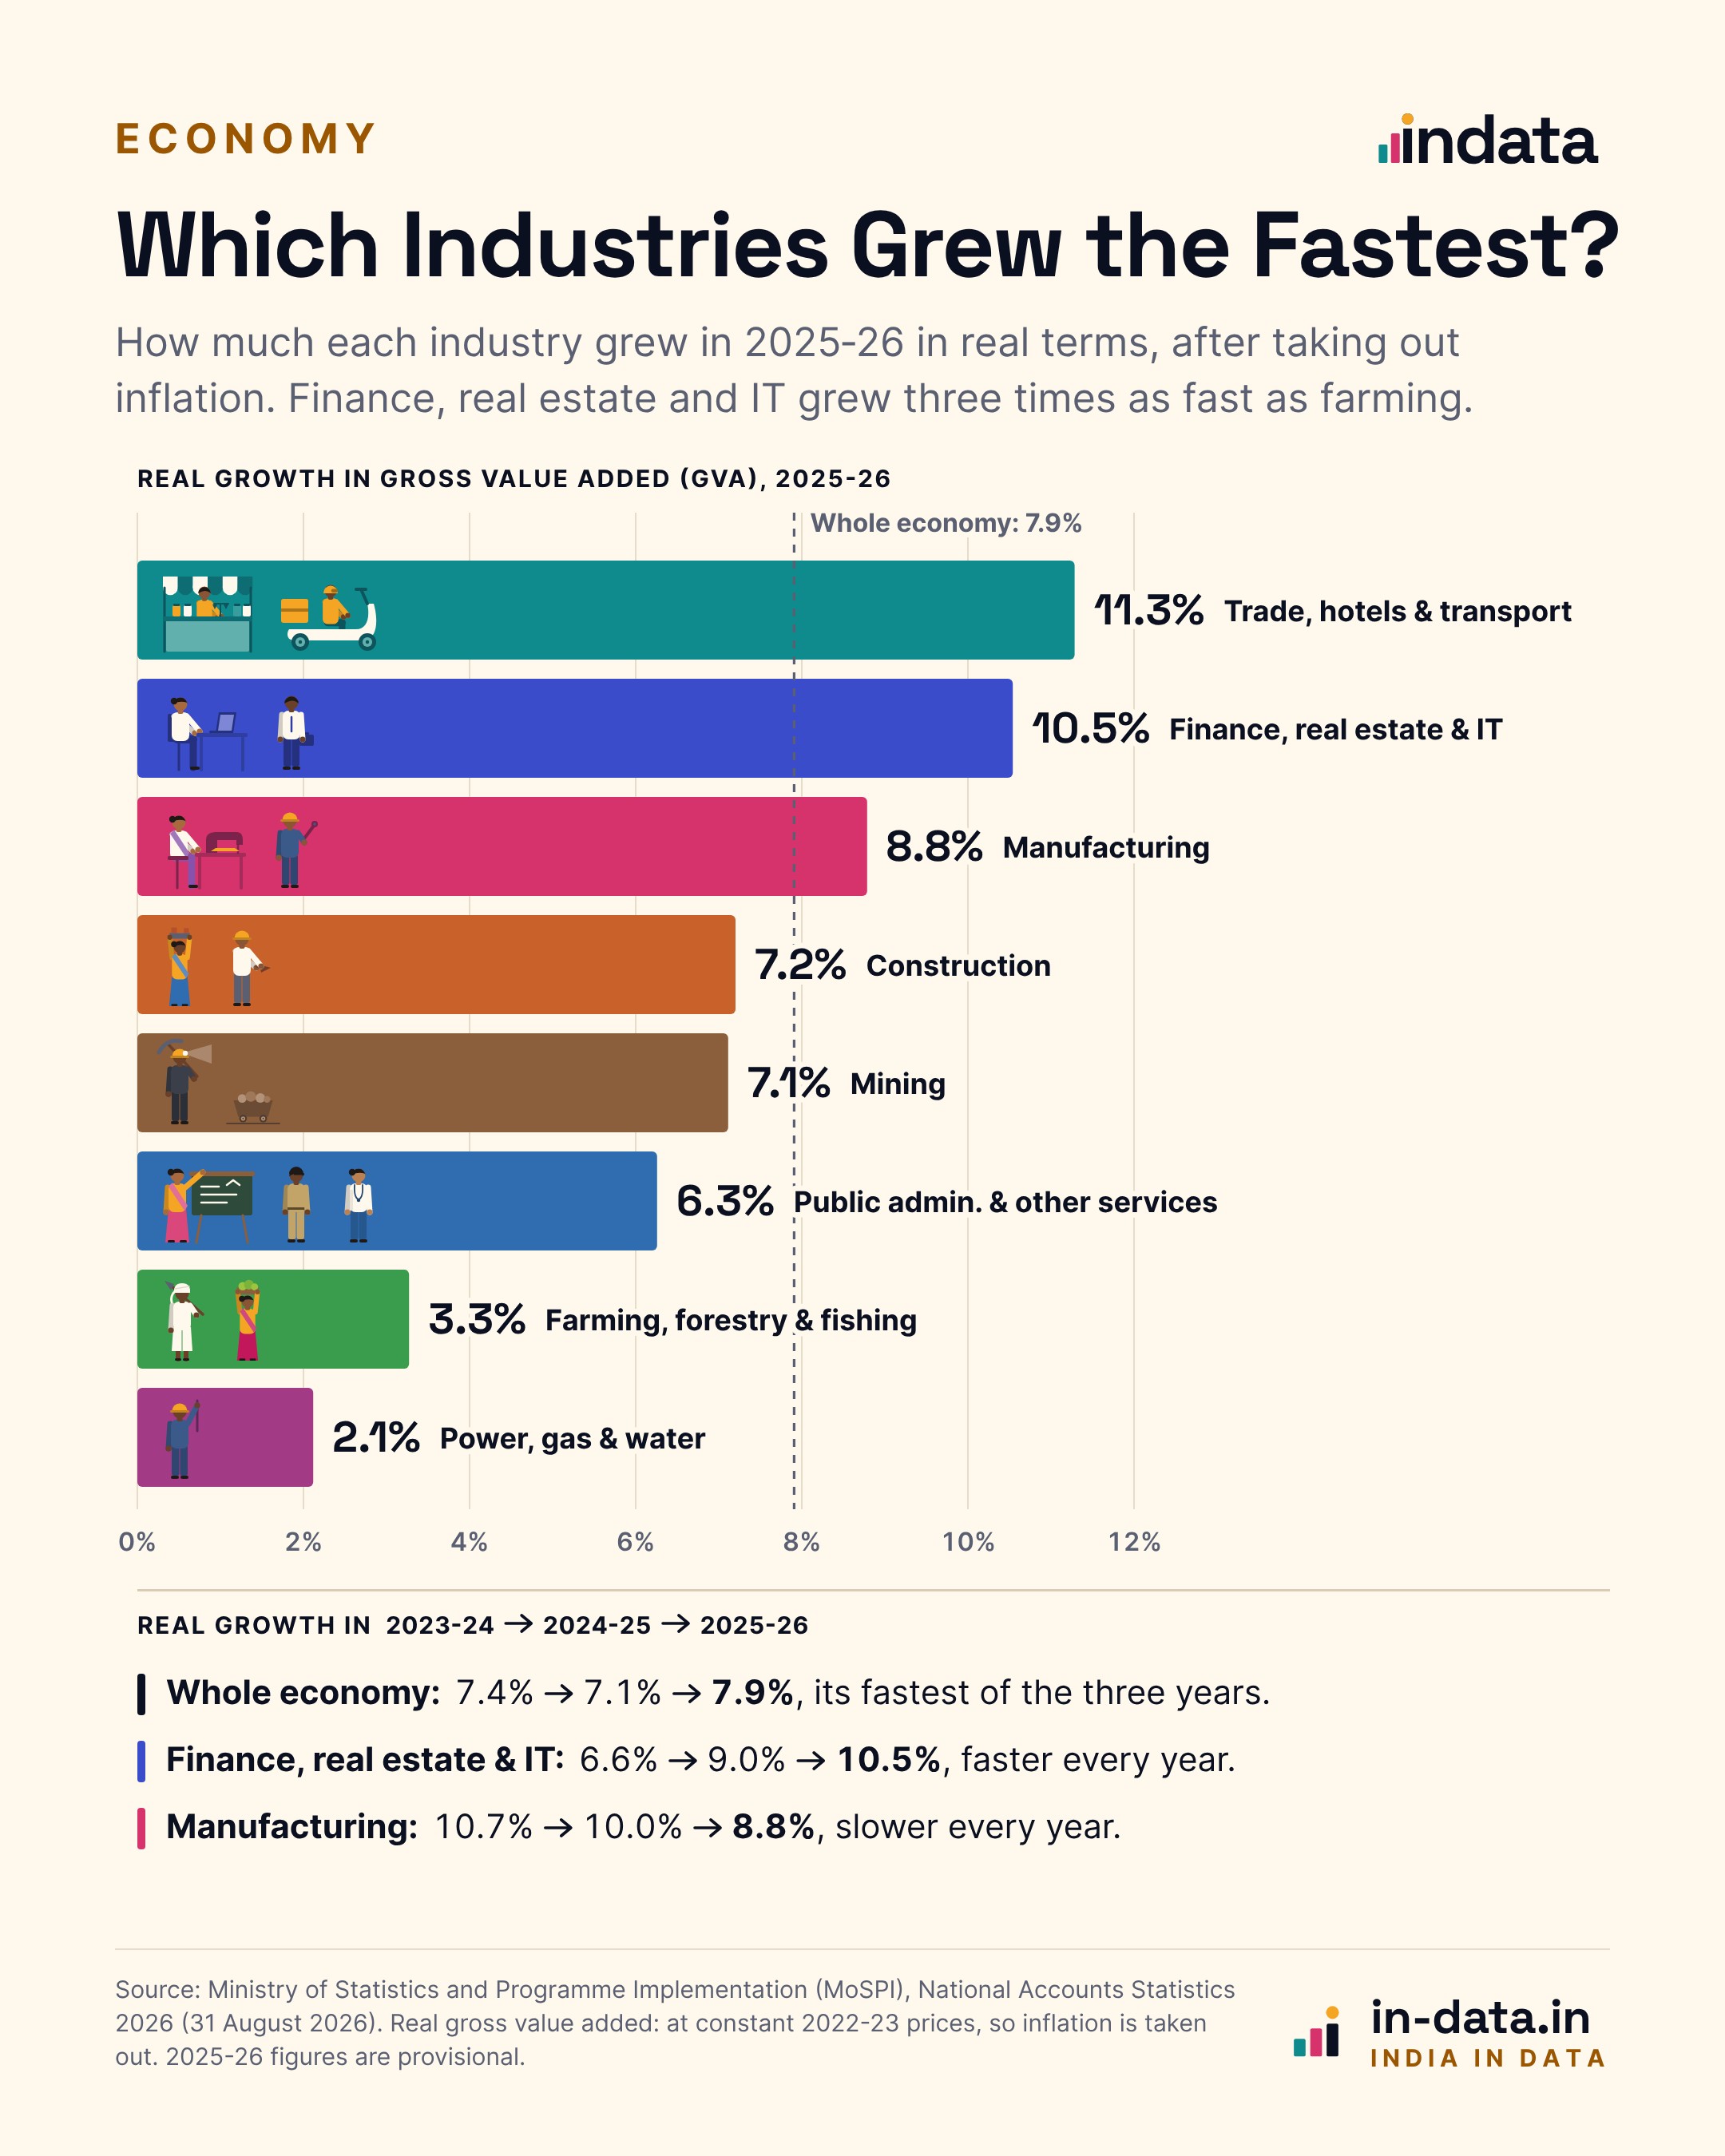
Over the last three years, two trends stand out. Finance, real estate and IT has grown faster every year, from 6.6% in 2023-24 to 9.0% in 2024-25 and 10.5% in 2025-26. Meanwhile, manufacturing has slowed every year, from 10.7% to 10.0% to 8.8%. Overall, the economy’s 7.9% growth in GVA was its fastest of the three years.
Farms Employ 43% of Workers but Make 18% of the Value
However, the graphic shows where value is created, not where people work. According to MoSPI’s Periodic Labour Force Survey, 43.0% of India’s workers were in agriculture in 2025, more than in any other industry, even though agriculture produced 18.2% of the value.
In other words, the average farm worker produces under a third of the value of the average worker in the rest of the economy. That said, agriculture’s share of workers is falling: it was 44.8% in 2024, while manufacturing’s rose from 11.6% to 12.1% and other services’ from 12.2% to 13.1%. Even so, more than two in five Indian workers are in farming.
How the Mix Has Shifted Since 2022‑23
India’s national accounts now run on 2022-23 as their base year. MoSPI released the new series in February 2026, replacing the 2011-12 base and drawing on newer data such as goods and services tax (GST) returns.
Even in just three years on that series, services rose from 52.0% of GVA to 54.0%, while agriculture slipped from 19.9% to 18.2%. Manufacturing, meanwhile, held steady at about 15%. In other words, India’s farms aren’t shrinking; the rest of the economy is growing faster.
For the companies behind some of these numbers, see India’s 100 most profitable companies.
Source and method
MoSPI, National Accounts Statistics 2026, released 31 August 2026 (press release). Real GDP growth of 7.8% is from the same release; GVA grew 7.9%. Shares, values and real growth are from Statement 8.17.2, the updated Provisional Estimates of GVA by economic activity for 2025-26 at current and constant (2022-23) prices; these replace the first Provisional Estimates of 5 June 2026. The detail on ownership of dwellings, IT, real estate and professional services is from Statement 8.13 (2024-25, First Revised Estimates). Agriculture’s share in 1950 is from an older GDP series, so it is not strictly comparable with today’s figures. Industry names are shortened from MoSPI’s eight sectors, and the groups (services, industry, farming and mining) follow its tertiary, secondary and primary sectors. Shares are InData’s calculation from the statement and may not add up because of rounding. Figures for 2025-26 are provisional and will be revised. Employment shares are from the Periodic Labour Force Survey annual report for January to December 2025 (usual status), so they cover a slightly different period from the GDP year.