India’s Most Profitable Companies in 2025: The Top 100, Ranked
Which Indian companies made the most profit? We rank the top 100 non-financial companies by net profit in FY25.
Key takeawayReliance Industries made more profit than all 13 pharma and healthcare companies on the list put together.
Net profit is what a company has left from a year’s income after it has paid its costs, interest and taxes.
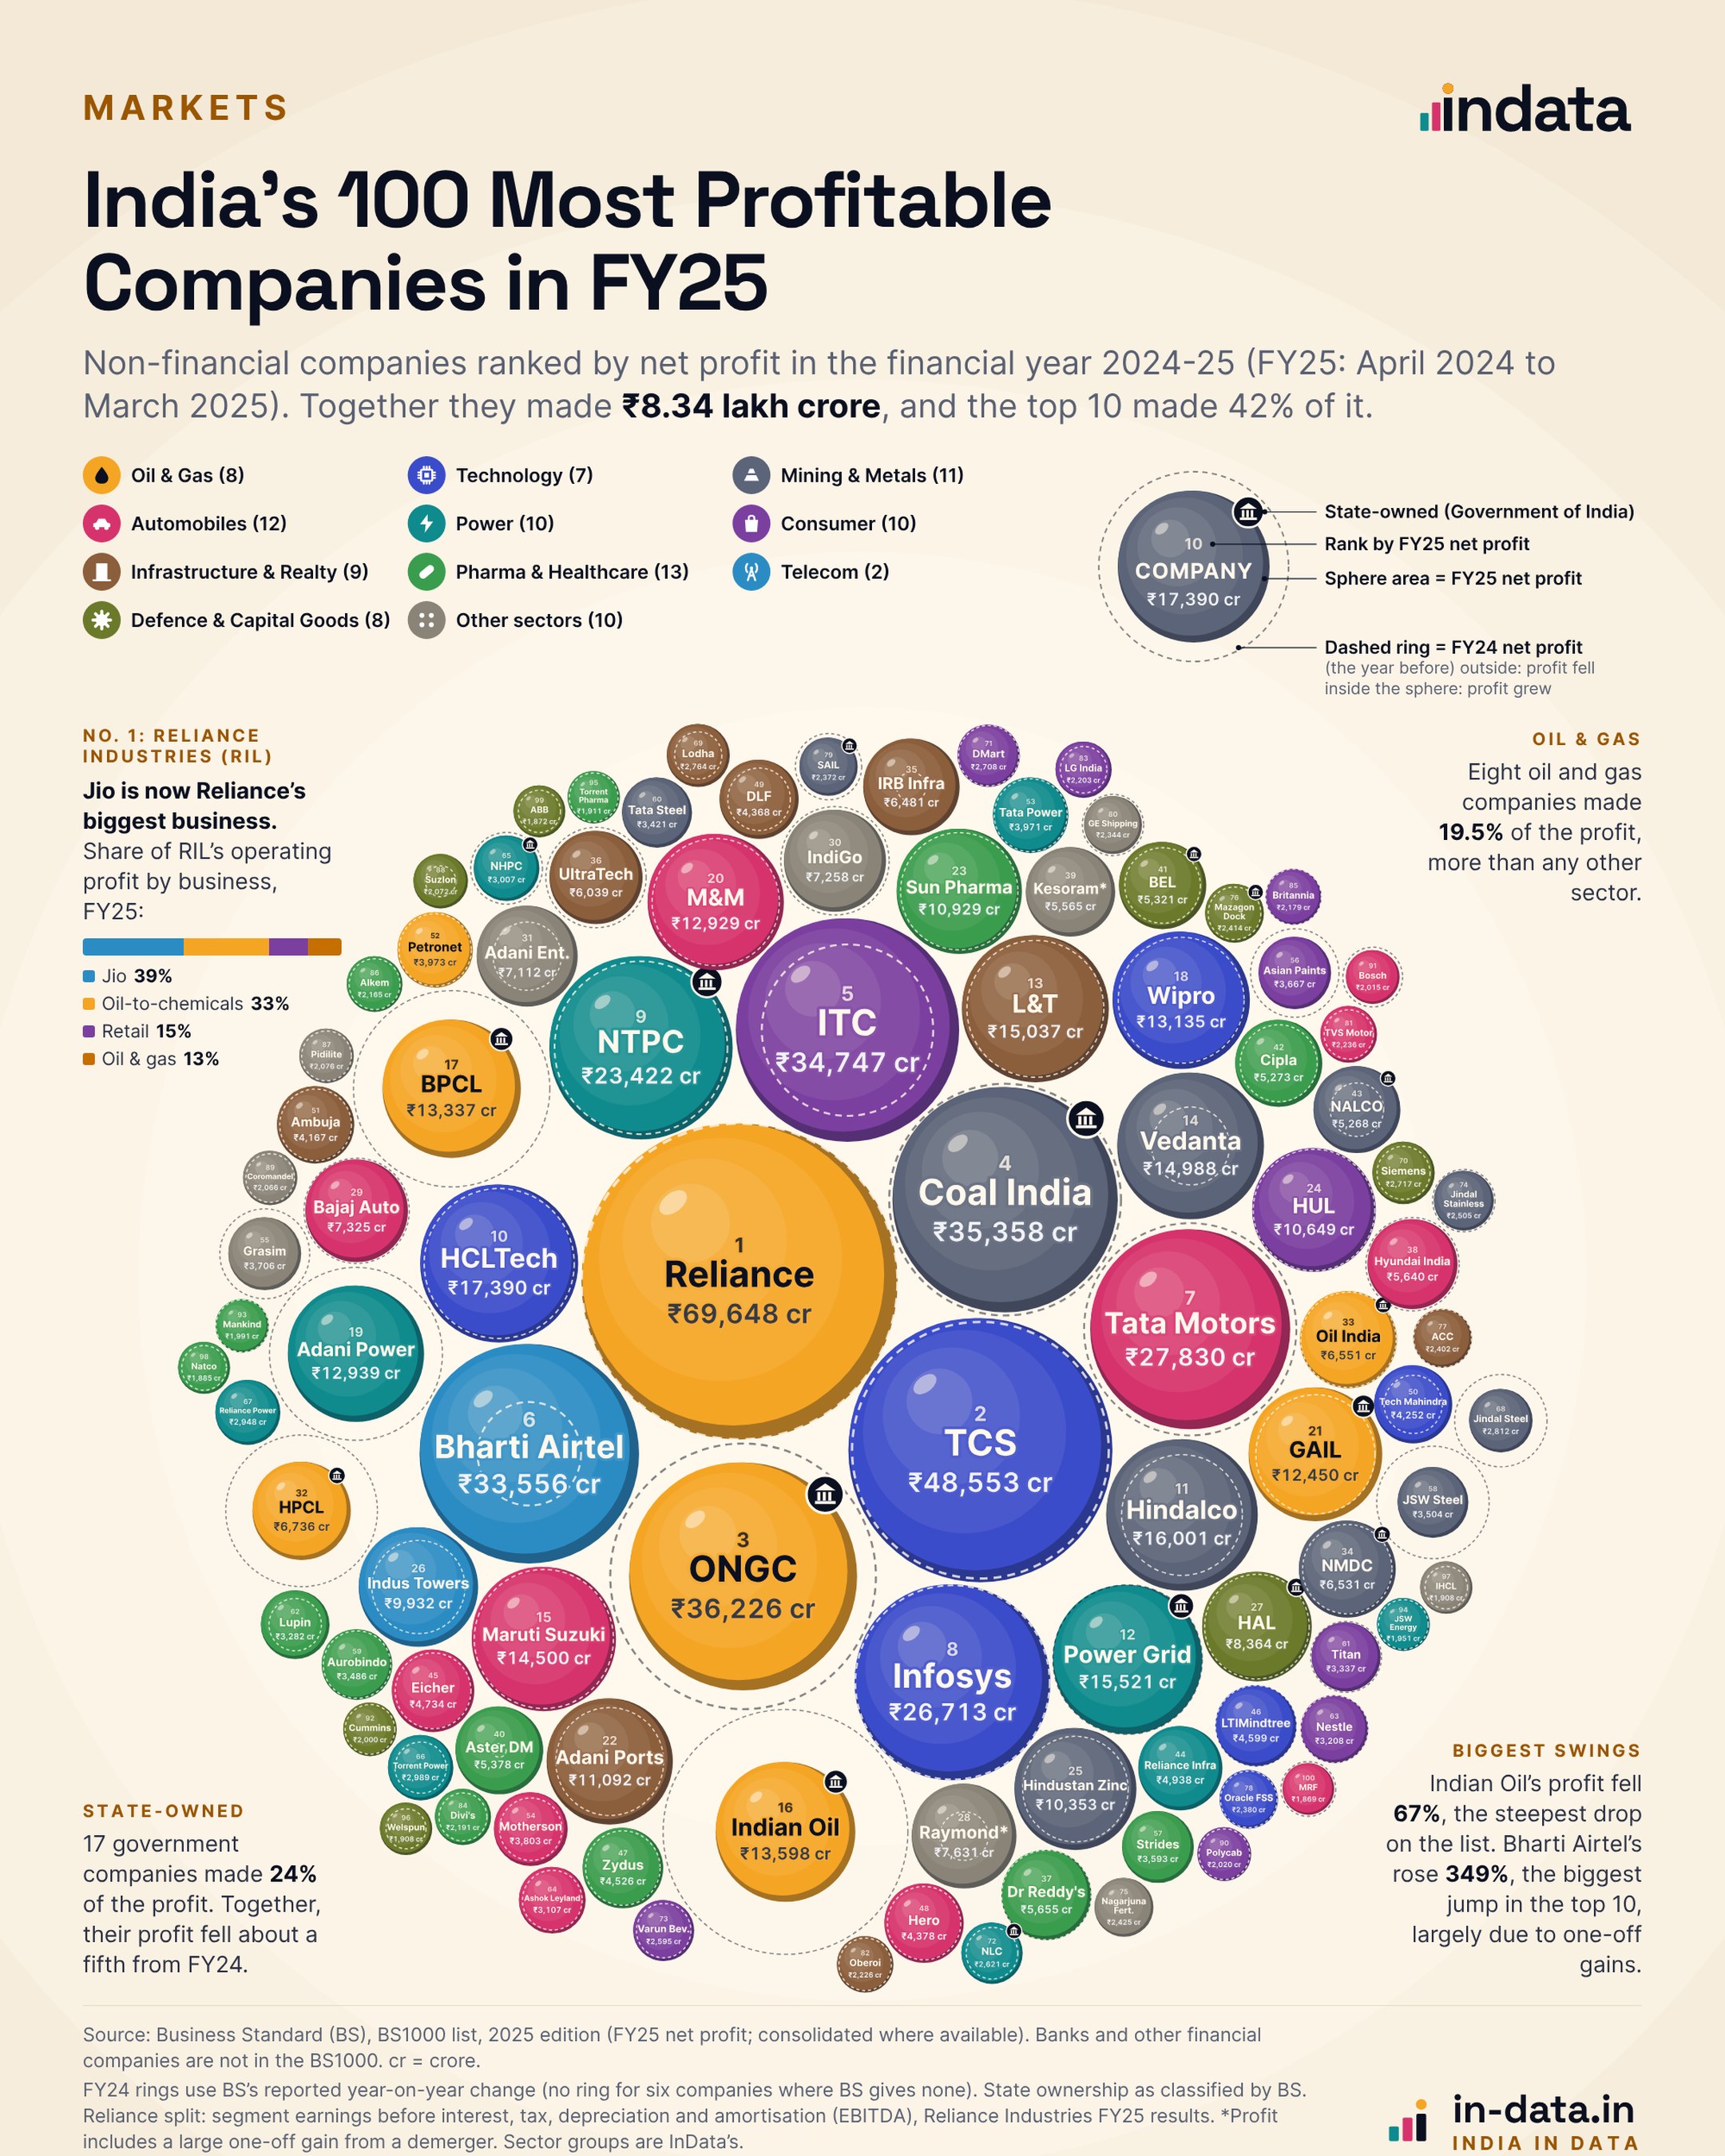
This graphic shows India’s most profitable companies in the financial year 2024-25 (FY25), which ran from April 2024 to March 2025: the 100 with the largest net profit in the BS1000, the annual list of 1,000 companies published by the newspaper Business Standard (BS).
The BS1000 covers non-financial companies only, so no bank, insurer or other lender appears here. Each sphere is one company, and its area is in proportion to its net profit. The dashed ring around a sphere shows the profit of the year before: a ring outside the sphere means profit fell, a ring inside means it grew.
Together the 100 companies made ₹8,33,728 crore, or ₹8.34 lakh crore. It was far from evenly spread.
The top 10 made 42% of it. The 50 companies in the lower half of the list made 16% between them: less than the top three alone.
India’s Most Profitable Companies in FY25: the Full List
Reliance Industries is first with ₹69,648 crore, ahead of Tata Consultancy Services (TCS) with ₹48,553 crore. Three of the top ten are owned by the Government of India: Oil and Natural Gas Corporation (ONGC), Coal India and NTPC.
70 companies saw a rise in profit, and 23 companies saw a fall.
Showing 10 companies at a time. Tap a column heading to sort by it.
| Rank | Company | Net profit, FY25 (₹ crore) | Change from FY24 | Sector |
|---|---|---|---|---|
| 1 | Reliance Industries | 69,648 | 0.0% | Oil & Gas |
| 2 | Tata Consultancy Services | 48,553 | +5.8% | Technology |
| 3 | ONGC | 36,226 | −26.3% | Oil & Gas |
| 4 | Coal India | 35,358 | −5.5% | Mining & Metals |
| 5 | ITC | 34,747 | +69.8% | Consumer |
| 6 | Bharti Airtel | 33,556 | +349.4% | Telecom |
| 7 | Tata Motors | 27,830 | −11.4% | Automobiles |
| 8 | Infosys | 26,713 | +1.8% | Technology |
| 9 | NTPC | 23,422 | +12.5% | Power |
| 10 | HCL Technologies | 17,390 | +10.8% | Technology |
| 11 | Hindalco Industries | 16,001 | +57.6% | Mining & Metals |
| 12 | Power Grid Corporation | 15,521 | −0.3% | Power |
| 13 | Larsen & Toubro | 15,037 | +15.1% | Infrastructure & Realty |
| 14 | Vedanta | 14,988 | +253.6% | Mining & Metals |
| 15 | Maruti Suzuki India | 14,500 | +7.5% | Automobiles |
| 16 | Indian Oil Corporation | 13,598 | −67.4% | Oil & Gas |
| 17 | Bharat Petroleum Corporation | 13,337 | −50.3% | Oil & Gas |
| 18 | Wipro | 13,135 | +18.9% | Technology |
| 19 | Adani Power | 12,939 | −37.9% | Power |
| 20 | Mahindra & Mahindra | 12,929 | +14.7% | Automobiles |
| 21 | GAIL (India) | 12,450 | +25.8% | Oil & Gas |
| 22 | Adani Ports & SEZ | 11,092 | +36.8% | Infrastructure & Realty |
| 23 | Sun Pharmaceutical Industries | 10,929 | +14.1% | Pharma & Healthcare |
| 24 | Hindustan Unilever | 10,649 | +3.6% | Consumer |
| 25 | Hindustan Zinc | 10,353 | +33.4% | Mining & Metals |
| 26 | Indus Towers | 9,932 | +64.5% | Telecom |
| 27 | Hindustan Aeronautics | 8,364 | +9.8% | Defence & Capital Goods |
| 28 | Raymond* | 7,631 | +366.0% | Other sectors |
| 29 | Bajaj Auto | 7,325 | −5.0% | Automobiles |
| 30 | Interglobe Aviation | 7,258 | −11.2% | Other sectors |
| 31 | Adani Enterprises | 7,112 | +119.5% | Other sectors |
| 32 | HPCL | 6,736 | −57.9% | Oil & Gas |
| 33 | Oil India | 6,551 | +3.4% | Oil & Gas |
| 34 | NMDC | 6,531 | +17.2% | Mining & Metals |
| 35 | IRB Infrastructure Developers | 6,481 | +969.7% | Infrastructure & Realty |
| 36 | UltraTech Cement | 6,039 | −13.8% | Infrastructure & Realty |
| 37 | Dr Reddy's Laboratories | 5,655 | +1.4% | Pharma & Healthcare |
| 38 | Hyundai Motor India | 5,640 | −6.9% | Automobiles |
| 39 | Kesoram Industries* | 5,565 | No comparison | Other sectors |
| 40 | Aster DM Healthcare | 5,378 | +4059.8% | Pharma & Healthcare |
| 41 | Bharat Electronics | 5,321 | +33.6% | Defence & Capital Goods |
| 42 | Cipla | 5,273 | +27.9% | Pharma & Healthcare |
| 43 | National Aluminium Company | 5,268 | +164.9% | Mining & Metals |
| 44 | Reliance Infrastructure | 4,938 | No comparison | Power |
| 45 | Eicher Motors | 4,734 | +18.3% | Automobiles |
| 46 | LTIMindtree | 4,599 | +0.4% | Technology |
| 47 | Zydus Lifesciences | 4,526 | +17.3% | Pharma & Healthcare |
| 48 | Hero MotoCorp | 4,378 | +16.9% | Automobiles |
| 49 | DLF | 4,368 | +60.2% | Infrastructure & Realty |
| 50 | Tech Mahindra | 4,252 | +80.3% | Technology |
| 51 | Ambuja Cements | 4,167 | +16.6% | Infrastructure & Realty |
| 52 | Petronet LNG | 3,973 | +8.8% | Oil & Gas |
| 53 | Tata Power Company | 3,971 | +7.4% | Power |
| 54 | Samvardhana Motherson | 3,803 | +40.0% | Automobiles |
| 55 | Grasim Industries | 3,706 | −34.1% | Other sectors |
| 56 | Asian Paints | 3,667 | −32.8% | Consumer |
| 57 | Strides Pharma Science | 3,593 | No comparison | Pharma & Healthcare |
| 58 | JSW Steel | 3,504 | −60.2% | Mining & Metals |
| 59 | Aurobindo Pharma | 3,486 | +9.9% | Pharma & Healthcare |
| 60 | Tata Steel | 3,421 | No comparison | Mining & Metals |
| 61 | Titan Company | 3,337 | −4.5% | Consumer |
| 62 | Lupin | 3,282 | +71.4% | Pharma & Healthcare |
| 63 | Nestle India | 3,208 | +1.9% | Consumer |
| 64 | Ashok Leyland | 3,107 | +25.1% | Automobiles |
| 65 | NHPC | 3,007 | −16.4% | Power |
| 66 | Torrent Power | 2,989 | +63.0% | Power |
| 67 | Reliance Power | 2,948 | No comparison | Power |
| 68 | Jindal Steel | 2,812 | −52.6% | Mining & Metals |
| 69 | Lodha Developers | 2,764 | +78.4% | Infrastructure & Realty |
| 70 | Siemens | 2,717 | +38.5% | Defence & Capital Goods |
| 71 | Avenue Supermarts | 2,708 | +6.8% | Consumer |
| 72 | NLC India | 2,621 | +41.4% | Power |
| 73 | Varun Beverages | 2,595 | +26.2% | Consumer |
| 74 | Jindal Stainless | 2,505 | −7.7% | Mining & Metals |
| 75 | Nagarjuna Fertilizers & Chemicals | 2,425 | No comparison | Other sectors |
| 76 | Mazagon Dock Shipbuilders | 2,414 | +24.6% | Defence & Capital Goods |
| 77 | ACC | 2,402 | +2.8% | Infrastructure & Realty |
| 78 | Oracle Financial Services Software | 2,380 | +7.2% | Technology |
| 79 | Steel Authority of India | 2,372 | −22.7% | Mining & Metals |
| 80 | Great Eastern Shipping Company | 2,344 | −10.3% | Other sectors |
| 81 | TVS Motor Company | 2,236 | +32.6% | Automobiles |
| 82 | Oberoi Realty | 2,226 | +15.5% | Infrastructure & Realty |
| 83 | LG Electronics India | 2,203 | +45.8% | Consumer |
| 84 | Divi's Laboratories | 2,191 | +36.9% | Pharma & Healthcare |
| 85 | Britannia Industries | 2,179 | +1.8% | Consumer |
| 86 | Alkem Laboratories | 2,165 | +20.6% | Pharma & Healthcare |
| 87 | Pidilite Industries | 2,076 | +20.1% | Other sectors |
| 88 | Suzlon Energy | 2,072 | +213.7% | Defence & Capital Goods |
| 89 | Coromandel International | 2,066 | +25.8% | Other sectors |
| 90 | Polycab India | 2,020 | +13.2% | Consumer |
| 91 | Bosch | 2,015 | −19.1% | Automobiles |
| 92 | Cummins India | 2,000 | +16.2% | Defence & Capital Goods |
| 93 | Mankind Pharma | 1,991 | +4.1% | Pharma & Healthcare |
| 94 | JSW Energy | 1,951 | +13.2% | Power |
| 95 | Torrent Pharmaceuticals | 1,911 | +15.4% | Pharma & Healthcare |
| 96 | Welspun Corp | 1,908 | +71.8% | Defence & Capital Goods |
| 97 | Indian Hotels Co | 1,908 | +51.5% | Other sectors |
| 98 | Natco Pharma | 1,885 | +35.8% | Pharma & Healthcare |
| 99 | ABB India | 1,872 | +50.7% | Defence & Capital Goods |
| 100 | MRF | 1,869 | −10.2% | Automobiles |
Net profit as reported in the BS1000, consolidated (the company and its subsidiaries together) where available. Change is from the financial year 2023-24 (FY24), as reported by Business Standard; it gives no comparison for six companies. *Profit includes a large one-off gain from a demerger. Sector groups are InData’s.
At the foot of the list is the tyre maker MRF, with ₹1,869 crore. Reliance made 37 times as much. Put another way, MRF’s whole year is about ten days of Reliance’s profit.
Not every jump is growth
A 349% rise in profit sounds like a company whose business more than quadrupled. Sometimes it is an accounting event.
Net profit includes one-off items: gains or losses from things that do not repeat, such as selling a business or revaluing an asset. Several of the largest rises on this list come from such items.
Bharti Airtel is the largest case. Business Standard reports its profit at ₹33,556 crore, up 349.4%. Airtel’s own report for the year shows that exceptional items added a net ₹15,983 crore in FY25, after taking away ₹3,838 crore the year before. Without them, its net income rose 53%, from ₹11,620 crore to ₹17,761 crore: a large rise, but not a quadrupling.
Most of the gain came in two quarters. In October to December 2024, Airtel began counting the tower company Indus Towers as a subsidiary and revalued the stake it already held; the company said that quarter’s exceptional items were primarily due to the consolidation of Indus Towers. In January to March 2025 it recorded about ₹5,900 crore of tax assets it had not recognised before.
ITC, fifth on the list, separated its hotels into a new company, ITC Hotels, from 1 January 2025 and recorded an exceptional gain of ₹15,163 crore. That is about 44% of the ₹34,747 crore shown here.
The pattern repeats further down. Raymond recorded a gain of about ₹7,338 crore when it split off its lifestyle (clothing) business, nearly all of its profit. Kesoram Industries recorded ₹5,676 crore on transferring its cement business to UltraTech Cement. Aster DM Healthcare recorded ₹5,148 crore on separating its hospitals in the Gulf from its Indian business. IRB Infrastructure Developers, a toll-road company, reported a one-off gain of ₹5,804 crore from revaluing its holdings in its road investment trusts, according to a summary of its results.
It works the other way too. Tata Motors’ profit fell 11.4% partly because the year before had been lifted by a one-time tax benefit.
State-owned companies: a quarter of the profit, and shrinking
Seventeen of the 100 companies are owned by the Government of India. They made ₹1,99,097 crore, or 24% of the total.
Working back from each company’s reported change, their combined profit was about 21% lower than the year before. Almost all of that fall traces to three fuel retailers.
Indian Oil Corporation’s profit fell 67.4%, the steepest drop on the list. HPCL’s fell 57.9% and Bharat Petroleum Corporation’s 50.3%. Between them, the three made about ₹51,000 crore less than the year before. That is more than TCS, the second most profitable company on the list, made in the whole year.
Two things hurt them. The first was the refining margin: the gap between what a refinery pays for crude oil and what it earns from the fuels it makes. Indian Oil’s fell to $4.80 a barrel from $12.05, and Bharat Petroleum’s to $6.82 from $14.14.
The second was cooking gas. The companies sell household cylinders of liquefied petroleum gas (LPG) below cost. Indian Oil lost about ₹19,000 crore this way in the year and Bharat Petroleum ₹10,446 crore, the same reports say. The report on Bharat Petroleum adds that the government did not compensate the retailers during the year.
Reliance: Jio is now its biggest business
Reliance Industries is counted under oil and gas here. But in FY25 its digital arm, Jio, was its largest business by operating profit.
Of the earnings before interest, tax, depreciation and amortisation (EBITDA) of Reliance’s business segments, Jio made 39%, oil-to-chemicals 33%, retail 15% and oil and gas production 13%, according to the company’s results presentation. The two oil businesses together, at 46%, are still larger than Jio.
The split uses operating profit because Reliance does not report a net profit for each segment. The ₹69,648 crore in the ranking is the profit that belongs to Reliance’s shareholders; including the share of other investors in its subsidiaries, the group made ₹81,309 crore.
The 100 companies, sector by sector
We sorted the 100 companies into eleven groups. Here is each one, from the most profit to the least. The rank shown in each table is the company’s rank in the full list.
Oil and gas: the most profit, and the steepest fall
Eight oil and gas companies made ₹1,62,519 crore, or 19.5% of the list’s profit. No sector made more.
The list’s steepest fall is here too. Indian Oil, Bharat Petroleum and HPCL, the three state-owned fuel retailers, each lost at least half of their profit, squeezed between thinner refining margins and cooking gas sold below cost.
Not everyone in the sector had that kind of year. ONGC, which pumps oil and gas out of the ground, fell 26.3%. GAIL, which moves gas through pipelines, rose 25.8%. And Reliance, 43% of the sector on its own, stood still.
| Rank | Company | Net profit, FY25 (₹ crore) | Change from FY24 |
|---|---|---|---|
| 1 | Reliance Industries | 69,648 | 0.0% |
| 3 | ONGC (state-owned) | 36,226 | −26.3% |
| 16 | Indian Oil Corporation (state-owned) | 13,598 | −67.4% |
| 17 | Bharat Petroleum Corporation (state-owned) | 13,337 | −50.3% |
| 21 | GAIL (India) (state-owned) | 12,450 | +25.8% |
| 32 | HPCL (state-owned) | 6,736 | −57.9% |
| 33 | Oil India (state-owned) | 6,551 | +3.4% |
| 52 | Petronet LNG | 3,973 | +8.8% |
Net profit as reported by Business Standard. Change is from the financial year 2023-24 (FY24).
Technology: big profits, small moves
India’s software exporters are the second most profitable group on the list: seven companies, ₹1,17,022 crore, or 14.0% of the list’s profit. Tata Consultancy Services (TCS) alone made more than Infosys and HCL Technologies combined.
What they did not do in FY25 is grow much. TCS’s profit rose 5.8% and Infosys’s 1.8%. TCS’s revenue crossed $30 billion in the year, but grew 4.2% once currency swings are taken out, amid macroeconomic uncertainty.
Tech Mahindra is the exception, up 80.3%. Even so, its ₹4,252 crore is less than a tenth of what TCS made.
| Rank | Company | Net profit, FY25 (₹ crore) | Change from FY24 |
|---|---|---|---|
| 2 | Tata Consultancy Services | 48,553 | +5.8% |
| 8 | Infosys | 26,713 | +1.8% |
| 10 | HCL Technologies | 17,390 | +10.8% |
| 18 | Wipro | 13,135 | +18.9% |
| 46 | LTIMindtree | 4,599 | +0.4% |
| 50 | Tech Mahindra | 4,252 | +80.3% |
| 78 | Oracle Financial Services Software | 2,380 | +7.2% |
Net profit as reported by Business Standard. Change is from the financial year 2023-24 (FY24).
Mining and metals: aluminium up, steel down
Eleven companies made ₹1,03,113 crore, or 12.4% of the list’s profit. State-owned Coal India made about a third of that, even after its profit slipped 5.5%: the price it got for coal sold at auction fell from ₹3,066 to ₹2,541 a tonne.
Beyond coal, the sector split down the middle. The producers of aluminium and other non-ferrous metals rose. Hindalco reported the highest annual profit in its history, National Aluminium Company (NALCO) rose 164.9% and Vedanta 253.6%.
Steel went the other way. JSW Steel fell 60.2%, Jindal Steel 52.6% and Steel Authority of India 22.7%, in a year when steelmakers faced weak demand and cheaper imports, especially from China and Southeast Asia.
| Rank | Company | Net profit, FY25 (₹ crore) | Change from FY24 |
|---|---|---|---|
| 4 | Coal India (state-owned) | 35,358 | −5.5% |
| 11 | Hindalco Industries | 16,001 | +57.6% |
| 14 | Vedanta | 14,988 | +253.6% |
| 25 | Hindustan Zinc | 10,353 | +33.4% |
| 34 | NMDC (state-owned) | 6,531 | +17.2% |
| 43 | National Aluminium Company (state-owned) | 5,268 | +164.9% |
| 58 | JSW Steel | 3,504 | −60.2% |
| 60 | Tata Steel | 3,421 | No comparison |
| 68 | Jindal Steel | 2,812 | −52.6% |
| 74 | Jindal Stainless | 2,505 | −7.7% |
| 79 | Steel Authority of India (state-owned) | 2,372 | −22.7% |
Net profit as reported by Business Standard. Change is from the financial year 2023-24 (FY24).
Automobiles: Tata Motors made nearly twice Maruti’s profit
Maruti Suzuki is the best-selling car brand in almost every Indian state. It is not the most profitable carmaker. Tata Motors, which owns Jaguar Land Rover, made ₹27,830 crore, nearly twice Maruti’s ₹14,500 crore.
Tata Motors’ profit still fell 11.4%, partly because the year before had been lifted by a one-time tax benefit.
Twelve automobile companies are on the list, with ₹90,366 crore, or 10.8% of the list’s profit. Most of the two-wheeler makers gained: TVS Motor rose 32.6%, Eicher Motors, which makes Royal Enfield motorcycles, 18.3% and Hero MotoCorp 16.9%. Bajaj Auto slipped 5.0%.
| Rank | Company | Net profit, FY25 (₹ crore) | Change from FY24 |
|---|---|---|---|
| 7 | Tata Motors | 27,830 | −11.4% |
| 15 | Maruti Suzuki India | 14,500 | +7.5% |
| 20 | Mahindra & Mahindra | 12,929 | +14.7% |
| 29 | Bajaj Auto | 7,325 | −5.0% |
| 38 | Hyundai Motor India | 5,640 | −6.9% |
| 45 | Eicher Motors | 4,734 | +18.3% |
| 48 | Hero MotoCorp | 4,378 | +16.9% |
| 54 | Samvardhana Motherson | 3,803 | +40.0% |
| 64 | Ashok Leyland | 3,107 | +25.1% |
| 81 | TVS Motor Company | 2,236 | +32.6% |
| 91 | Bosch | 2,015 | −19.1% |
| 100 | MRF | 1,869 | −10.2% |
Net profit as reported by Business Standard. Change is from the financial year 2023-24 (FY24).
Power: two state-owned giants made half
Ten power companies made ₹74,307 crore, or 8.9% of the list’s profit. Just over half came from two state-owned companies: NTPC, which generates electricity, and Power Grid Corporation, which carries it across the country.
Adani Power, the largest private company here, made ₹12,939 crore, down 37.9%. The company put the fall down to lower one-time income and a higher tax charge: the year before had included ₹9,322 crore of income relating to earlier years.
Two more names, Reliance Infrastructure and Reliance Power, belong to the Anil Ambani group. Business Standard gives no year-before comparison for either.
| Rank | Company | Net profit, FY25 (₹ crore) | Change from FY24 |
|---|---|---|---|
| 9 | NTPC (state-owned) | 23,422 | +12.5% |
| 12 | Power Grid Corporation (state-owned) | 15,521 | −0.3% |
| 19 | Adani Power | 12,939 | −37.9% |
| 44 | Reliance Infrastructure | 4,938 | No comparison |
| 53 | Tata Power Company | 3,971 | +7.4% |
| 65 | NHPC (state-owned) | 3,007 | −16.4% |
| 66 | Torrent Power | 2,989 | +63.0% |
| 67 | Reliance Power | 2,948 | No comparison |
| 72 | NLC India (state-owned) | 2,621 | +41.4% |
| 94 | JSW Energy | 1,951 | +13.2% |
Net profit as reported by Business Standard. Change is from the financial year 2023-24 (FY24).
Consumer: ITC, and then everyone else
Ten consumer companies made ₹67,313 crore, or 8.1% of the list’s profit. More than half of it was ITC.
About ₹15,163 crore of ITC’s profit was the one-off gain from separating its hotels. Take that away and it would still lead the sector comfortably, ahead of Hindustan Unilever’s ₹10,649 crore.
The makers of soap, noodles and biscuits barely grew: Hindustan Unilever rose 3.6%, Nestle India 1.9% and Britannia 1.8%. Asian Paints fell 32.8%, the steepest drop in the group. Its chief executive pointed to weak demand that had lasted several quarters, and the company cited tougher competition.
| Rank | Company | Net profit, FY25 (₹ crore) | Change from FY24 |
|---|---|---|---|
| 5 | ITC | 34,747 | +69.8% |
| 24 | Hindustan Unilever | 10,649 | +3.6% |
| 56 | Asian Paints | 3,667 | −32.8% |
| 61 | Titan Company | 3,337 | −4.5% |
| 63 | Nestle India | 3,208 | +1.9% |
| 71 | Avenue Supermarts | 2,708 | +6.8% |
| 73 | Varun Beverages | 2,595 | +26.2% |
| 83 | LG Electronics India | 2,203 | +45.8% |
| 85 | Britannia Industries | 2,179 | +1.8% |
| 90 | Polycab India | 2,020 | +13.2% |
Net profit as reported by Business Standard. Change is from the financial year 2023-24 (FY24).
Infrastructure and realty: every property developer grew
Nine companies made ₹54,576 crore, or 6.5% of the list’s profit. Larsen & Toubro, the engineering and construction group, leads with ₹15,037 crore, followed by Adani Ports.
All three property developers on the list grew: Lodha Developers by 78.4%, DLF by 60.2% and Oberoi Realty by 15.5%. DLF sold a record ₹21,223 crore of homes in the year, and nearly two-thirds of that came from a single project, the ultra-luxury Dahlias in Gurugram.
Cement was mixed: UltraTech fell 13.8% while Ambuja Cements rose 16.6%. IRB Infrastructure’s tenfold rise is the one-off accounting gain described above.
| Rank | Company | Net profit, FY25 (₹ crore) | Change from FY24 |
|---|---|---|---|
| 13 | Larsen & Toubro | 15,037 | +15.1% |
| 22 | Adani Ports & SEZ | 11,092 | +36.8% |
| 35 | IRB Infrastructure Developers | 6,481 | +969.7% |
| 36 | UltraTech Cement | 6,039 | −13.8% |
| 49 | DLF | 4,368 | +60.2% |
| 51 | Ambuja Cements | 4,167 | +16.6% |
| 69 | Lodha Developers | 2,764 | +78.4% |
| 77 | ACC | 2,402 | +2.8% |
| 82 | Oberoi Realty | 2,226 | +15.5% |
Net profit as reported by Business Standard. Change is from the financial year 2023-24 (FY24).
Pharma and healthcare: 13 companies, less profit than Reliance
No sector has more names on the list: 13. Yet together they made ₹52,265 crore, or 6.3% of the list’s profit. Reliance alone made more.
Sun Pharmaceutical Industries is the largest by a distance. Its ₹10,929 crore is almost exactly what the next two drugmakers, Dr Reddy’s Laboratories and Cipla, made put together.
Not one of the twelve companies with a year-before figure reported a fall. The only hospital chain here, Aster DM Healthcare, owes almost all of its profit to a one-off gain.
| Rank | Company | Net profit, FY25 (₹ crore) | Change from FY24 |
|---|---|---|---|
| 23 | Sun Pharmaceutical Industries | 10,929 | +14.1% |
| 37 | Dr Reddy's Laboratories | 5,655 | +1.4% |
| 40 | Aster DM Healthcare | 5,378 | +4059.8% |
| 42 | Cipla | 5,273 | +27.9% |
| 47 | Zydus Lifesciences | 4,526 | +17.3% |
| 57 | Strides Pharma Science | 3,593 | No comparison |
| 59 | Aurobindo Pharma | 3,486 | +9.9% |
| 62 | Lupin | 3,282 | +71.4% |
| 84 | Divi's Laboratories | 2,191 | +36.9% |
| 86 | Alkem Laboratories | 2,165 | +20.6% |
| 93 | Mankind Pharma | 1,991 | +4.1% |
| 95 | Torrent Pharmaceuticals | 1,911 | +15.4% |
| 98 | Natco Pharma | 1,885 | +35.8% |
Net profit as reported by Business Standard. Change is from the financial year 2023-24 (FY24).
Telecom: two companies, one group
Only two telecom companies make the top 100, and they are family. Indus Towers, which owns mobile towers, has been a subsidiary of Bharti Airtel since November 2024.
Together they made ₹43,488 crore, or 5.2% of the list’s profit. Airtel’s figure is swollen by the one-off gains described above. On its own before-one-offs number of ₹17,761 crore, it would sit near tenth place on this list, not sixth.
Where is Jio? Inside Reliance Industries, which reports it as one of its businesses, so it does not appear here under its own name.
| Rank | Company | Net profit, FY25 (₹ crore) | Change from FY24 |
|---|---|---|---|
| 6 | Bharti Airtel | 33,556 | +349.4% |
| 26 | Indus Towers | 9,932 | +64.5% |
Net profit as reported by Business Standard. Change is from the financial year 2023-24 (FY24).
Defence and capital goods: all eight grew
Eight companies made ₹26,668 crore, or 3.2% of the list’s profit. It is the smallest of the named sectors, and every company in it grew.
State-owned defence manufacturers lead. Hindustan Aeronautics made ₹8,364 crore and ended the year with orders worth ₹1.84 lakh crore, about six times its annual revenue. Bharat Electronics rose 33.6% and Mazagon Dock Shipbuilders 24.6%.
The largest rise was at the wind-turbine maker Suzlon Energy, 213.7%.
| Rank | Company | Net profit, FY25 (₹ crore) | Change from FY24 |
|---|---|---|---|
| 27 | Hindustan Aeronautics (state-owned) | 8,364 | +9.8% |
| 41 | Bharat Electronics (state-owned) | 5,321 | +33.6% |
| 70 | Siemens | 2,717 | +38.5% |
| 76 | Mazagon Dock Shipbuilders (state-owned) | 2,414 | +24.6% |
| 88 | Suzlon Energy | 2,072 | +213.7% |
| 92 | Cummins India | 2,000 | +16.2% |
| 96 | Welspun Corp | 1,908 | +71.8% |
| 99 | ABB India | 1,872 | +50.7% |
Net profit as reported by Business Standard. Change is from the financial year 2023-24 (FY24).
Other sectors: an airline, a hotel chain and two demergers
Ten companies fit none of the groups above. They made ₹42,091 crore, or 5.0% of the list’s profit, and they have little in common: an airline, two fertiliser makers, a shipping line, a hotel chain, an adhesives maker.
Raymond’s profit, the largest here, and Kesoram Industries’ are mostly one-off gains from splitting off businesses.
InterGlobe Aviation, which runs the airline IndiGo, made ₹7,258 crore, down 11.2%. Indian Hotels, which runs the Taj hotels, rose 51.5%. This group has no slide of its own in our carousel.
| Rank | Company | Net profit, FY25 (₹ crore) | Change from FY24 |
|---|---|---|---|
| 28 | Raymond* | 7,631 | +366.0% |
| 30 | Interglobe Aviation | 7,258 | −11.2% |
| 31 | Adani Enterprises | 7,112 | +119.5% |
| 39 | Kesoram Industries* | 5,565 | No comparison |
| 55 | Grasim Industries | 3,706 | −34.1% |
| 75 | Nagarjuna Fertilizers & Chemicals | 2,425 | No comparison |
| 80 | Great Eastern Shipping Company | 2,344 | −10.3% |
| 87 | Pidilite Industries | 2,076 | +20.1% |
| 89 | Coromandel International | 2,066 | +25.8% |
| 97 | Indian Hotels Co | 1,908 | +51.5% |
Net profit as reported by Business Standard. Change is from the financial year 2023-24 (FY24).
Source and method
Business Standard, BS1000 list, 2025 edition, read from the newspaper’s website and checked row by row on 15 November 2026. The list covers non-financial companies with accounts for years ended on or before 30 September 2025. Net profit is as Business Standard reports it: consolidated where available, after one-off items. The change from FY24 is Business Standard’s; FY24 rings on the graphic are worked back from it. Business Standard’s figures can differ slightly from a company’s own: Airtel, for example, reports ₹33,744 crore against Business Standard’s ₹33,556 crore. State ownership follows Business Standard’s “business house” column. The eleven sector groups are InData’s, made by merging Business Standard’s sector labels; Business Standard files Raymond under air transport, which we treat as an error and place in other sectors. The reasons given for rises and falls come from company statements and news reports, linked where they are used. The ranking does not show revenue, size or share price, only profit in one year.